SEO title: Construction Time-Lapse and Power BI: How Time-Lapse Cameras for Construction Are Becoming Part of BI Dashboards
Meta description: How construction time-lapse, time-lapse cameras for construction and Power BI help developers and contractors monitor site progress, manage projects and build live construction dashboards.
Keywords: construction time-lapse, time-lapse cameras for construction, Power BI for construction, construction project dashboard, construction site cameras
Construction time-lapse is no longer just a beautiful video at the end of a project
A few years ago, construction time-lapse was often seen mainly as a marketing asset: install a camera on site, capture images over several months, and at the end of the project show how a building grew from foundations to completion.
Today, things are very different.
Modern time-lapse cameras for construction have become part of the digital infrastructure of a construction project. They help teams not only create impressive final videos, but also continuously document progress, capture key project stages, provide remote visibility for clients and investors, and support communication across the project team.
The real value appears when construction time-lapse is connected with analytics.
A construction company does not simply want to see photographs from the site. It wants to understand how the project is progressing against the programme, which works have been completed, which areas are active, where delays may be emerging, which contractors are involved, and which indicators need attention.
That is why more and more clients want to see cameras, time-lapses and image archives not in a separate platform, but directly inside their BI dashboards.
This is where Power BI becomes extremely powerful.
Power BI as a live information dashboard for construction projects
Power BI has become one of the most widely used tools for management reporting. For a construction company, a Power BI dashboard can show:
- project status;
- percentage of completion;
- budget and cost variance;
- programme progress;
- key construction milestones;
- contractor information;
- risks and delays;
- visual site documentation.
However, in construction, numbers alone are not enough.
When a project director, client or investor sees a metric such as “47% complete”, they often want to see the real picture immediately: what is happening on site now, how the site looked last week, what changed during the month, and which works are visible on the ground.
This is why integrating construction time-lapse into Power BI is such a strong use case.
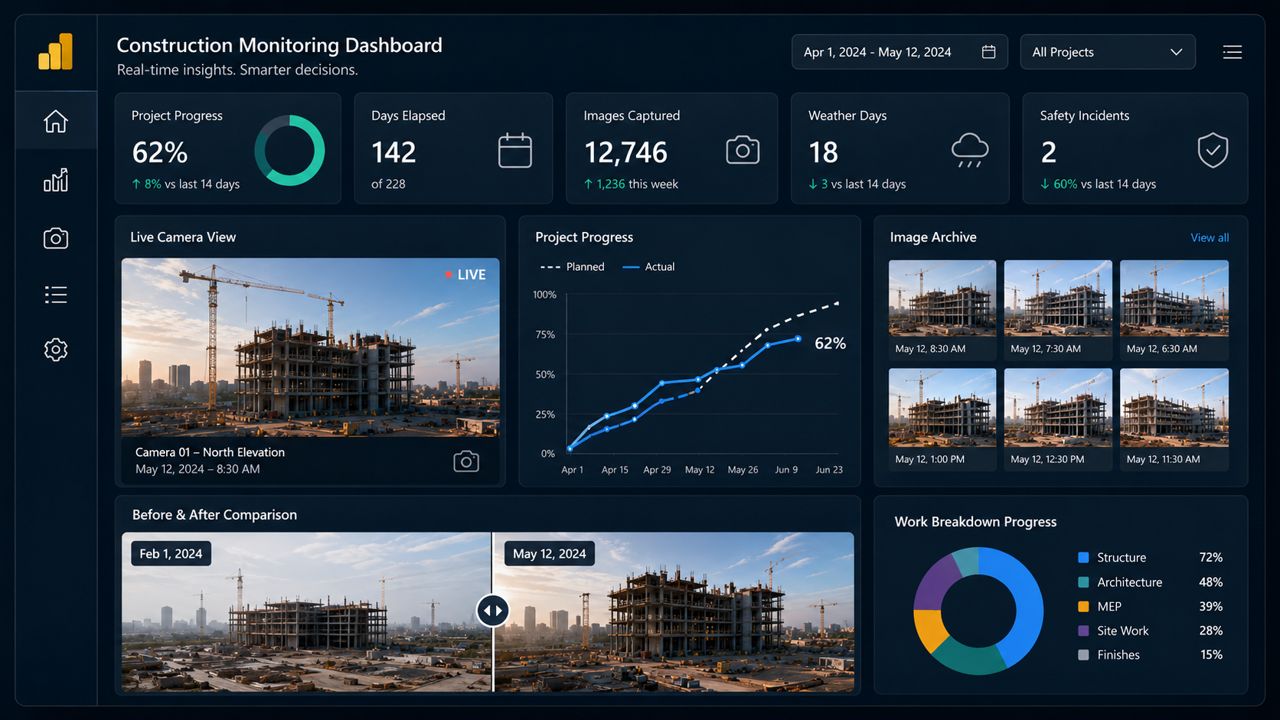
We often see the same scenario: a construction company is building a BI dashboard for its projects and wants to add a live site camera, construction time-lapse, image archive and photo comparison directly into the dashboard.
This is exactly what we do. We install time-lapse cameras for construction on project sites and help clients bring visual site data directly into Microsoft Power BI.
What construction time-lapse adds to Power BI
A time-lapse camera already provides value as a standalone solution. But when its data becomes part of a Power BI dashboard, the value increases significantly.
Firstly, it creates a single view of the project. Project teams no longer need to switch between separate systems: one for reporting, another for image archives, another for live cameras. Everything is available in one project information dashboard.
Secondly, visual data gives context to the numbers. If a dashboard shows that a stage is delayed, the user can immediately open the image archive and see how the site changed over the last few days or weeks.
Thirdly, construction time-lapse improves communication. Clients, investors and senior management understand progress much faster when KPIs are supported by real images from the site. It is no longer an abstract report — it is a live view of the project.
Fourthly, the image archive becomes a practical tool for reporting, review meetings and evidence-based decision-making. Teams can compare photos across different periods, understand progress visually, and confirm the presence of equipment, materials or completed works.
Photo comparison: one of the most useful features for construction teams
One of the features that construction teams value most is the ability to compare photographs from different dates.
For example, a user opens a Power BI dashboard and selects:
- the project;
- the camera;
- the “before” date;
- the “after” date.
They can then see two photographs from the same camera angle: for example, the site on 1 May and the site on 1 June. The difference becomes clear within seconds.
This is useful for project meetings, weekly reporting, client updates, internal monitoring and investor presentations.
This approach turns time-lapse cameras for construction from “a camera for a nice final video” into a real project management tool.
Why Microsoft’s PBIR news matters for construction time-lapse
In June 2026, Microsoft made an important step forward with Power BI. The new PBIR format and related capabilities are making Power BI reports more like managed software assets that can be stored, reviewed and developed as code.
For a typical business user, this may sound technical. But for teams building complex Power BI dashboards, it is very important.
PBIR allows the structure of a Power BI report to be stored as a set of files. Pages, visuals, settings and report elements become more transparent for development. This makes it easier to manage Power BI projects in GitHub, track changes, review updates, reuse templates and automate development.
For our team, this is particularly relevant because we do not only install time-lapse cameras for construction. We also help clients build Power BI dashboards that include:
- live video from the construction site;
- construction time-lapse;
- image archives;
- photo comparison by date;
- visual widgets for different projects;
- analytics for construction portfolios.
We work as a technical team. We use GitHub, we like the “infrastructure as code” approach, and we believe projects should be built in a way that makes them easier to maintain, scale and improve over time.
That is why PBIR is not just another Microsoft feature for us. It is a step towards making Power BI dashboards for construction faster, cleaner and more reliable to develop.
What changes in practice
Imagine a construction company has several active projects. For each project, it wants a Power BI dashboard with:
- an executive overview;
- a dedicated page for each site;
- a live camera widget;
- the latest site image;
- a time-lapse for a selected period;
- an image archive;
- photo comparison;
- KPIs for programme, budget and project status.
In the past, dashboards like this often required a lot of manual maintenance. Any change in design, structure or logic could take time, especially when similar dashboards were needed across multiple projects.
With PBIR, it becomes easier to apply a software engineering approach:
- store the Power BI project in GitHub;
- see exactly what changed in the report;
- reuse standard components more easily;
- create dashboard templates for different projects;
- automate parts of the development process;
- work more safely as a team;
- use AI tools to help create and validate reports.
This is especially valuable for construction companies managing a portfolio of projects, not just a single site.
AI agents and the future of Power BI dashboards for construction
Another important trend is the rise of AI agents in Power BI.
Microsoft is moving towards a future where AI tools can do more than simply answer questions about data. They can help create reports, modify visuals, work with semantic models and validate dashboard structure.
For construction time-lapse, this creates exciting possibilities.
In the future, we can imagine a workflow such as:
“Create a dashboard for this construction project. Add KPIs for programme progress, a block with the latest image from the site camera, a time-lapse for the last month and a photo comparison for selected dates.”
An AI agent could help build the report structure, while a developer reviews it, improves it and connects the real data, cameras and business logic.
This does not remove the need for specialists. In fact, the quality of the final solution will still depend on good data architecture, integrations, security, access control and user experience. But the speed of developing these solutions could increase significantly.
Construction time-lapse is becoming part of data-driven construction
The construction industry is becoming more digital. More companies want to manage projects not only through meetings, spreadsheets and PDF reports, but through live dashboards, data and visual evidence.
Construction time-lapse fits perfectly into this trend.
It answers a simple but very important question: “What is really happening on site?”
Power BI then connects that visual answer with numbers, schedules, budgets and management indicators.
When time-lapse cameras for construction are integrated into Power BI, a construction company gets more than just a camera and more than just a report. It gets a digital information dashboard for the project, where data and visual progress are available in one place.
Why this matters for clients
For senior management, it means greater transparency.
For project managers, it means faster access to facts.
For clients and investors, it means clearer visual communication.
For contractors, it means an objective visual record of site progress.
For marketing teams, it means high-quality content about the project.
For analysts and IT teams, it means a more manageable Power BI reporting architecture.
And for us, as a company that installs time-lapse cameras for construction and integrates construction time-lapse into Power BI, Microsoft’s new capabilities mean these solutions can be delivered faster, more cleanly and at greater scale.
Conclusion
Construction time-lapse is no longer just a beautiful “before and after” video. It is now a tool for monitoring, documentation, communication and construction project management.
Integrating time-lapse cameras into Power BI makes it part of a complete BI system.
Microsoft’s new capabilities — PBIR, Power BI Projects, Git-friendly development and AI-assisted report authoring — make this process more mature. Power BI dashboards for construction can now be developed more like modern software: with version control, reusable templates, automation and faster delivery.
For construction companies, this is excellent news.
For the construction time-lapse market, it is excellent news too.
Because the future of construction reporting is not a collection of separate photos, spreadsheets and camera links. The future is a single project information dashboard where numbers, images, video, time-lapse and analytics work together.